WinDbg: setting up a cross-VM debugging, tips
29 Mar 2020Setting up WinDbg can be a real pain. This posts documents how to lessen the pain (or at least to make it less painful to do another setup).
Requirements:
- a Windows 10 VM (I use VMWare workstation)
- WinDbg (classic, not Preview) installed in that VM
Getting started with network KD
A few things to keep in mind:
- the debugee connects to the host
- you will have no error message if things fail
The reference documentation is here but is not that practical.
Network setup
- Clone the host VM into a target VM
- Add a second network interface to both VMs (this could probably be done before, but I have not tested it):
- make sure the interface hardware is supported by WinDbg
- set it up on a specific “LAN segment” so that only those two VMs are on it
- setup the host to be 192.168.0.1/24
- setup the target to be 192.168.0.2/24
- allow everything on the host firewall from this interface (or configure appropriate rules)
- make sure you can ping the host from the target
WinDbg setup, on the target
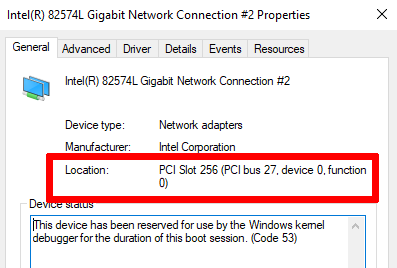
- go to the device manager to lookup the properties of your NIC (the one the LAN segment) and note the bus, device and function numbers

- in an elevated shell, run the following commands, replacing the
busparamsvalues with yours, andKEYwith something more secure (careful, use 4 dots):bcdedit /dbgsettings net HOSTIP:192.168.0.1 PORT:50000 KEY:TO.TO.TU.TU nodhcp bcdedit /set "{dbgsettings}" busparams 27.0.0 bcdedit /debug on
If you need more infos about the various options, see the documentation.
WinDbg setup, on the host:
- run WinDbg
- configure your symbol path to
cache*c:\MySymbols;srv*https://msdl.microsoft.com/download/symbols, by either:- using “File->Symbol file path”
- setting the
_NT_SYMBOL_PATHenvironment variable
- start a
Kernel Debugsession (Ctrl-K) - enter your
KEY, press OK (port 50000 should be the default) - (optional) run Wireshark on your LAN segment interface, to make sure the packets are reaching your interface
- command line to start it faster:
-k net:port=50000,key=TO.TO.TU.TU
Connecting things
Now, you can reboot your target, and you should get the following in your host’s WinDbg shell:
Connected to target 169.254.221.237 on port 50000 on local IP 192.168.0.1.
You can get the target MAC address by running .kdtargetmac command.
Connected to Windows 10 18362 x64 target at (Fri Mar 27 14:41:52.051 2020 (UTC + 1:00)), ptr64 TRUE
Kernel Debugger connection established.
As you can see, since we specified the nodhcp option in the target’s config, the source IP is in the “Automatic private IP” range. So if your host’s firewall is not completely open, make sure this range is allowed.
You can make sure things work correctly by disassembling some symbol:
0: kd> u ZwQueryInformationProcess
nt!ZwQueryInformationProcess:
fffff803`697bec50 488bc4          mov     rax,rsp
fffff803`697bec53 fa              cli
fffff803`697bec54 4883ec10        sub     rsp,10h
fffff803`697bec58 50              push    rax
fffff803`697bec59 9c              pushfq
fffff803`697bec5a 6a10            push    10h
fffff803`697bec5c 488d055d750000  lea     rax,[nt!KiServiceLinkage (fffff803`697c61c0)]
fffff803`697bec63 50              push    rax
WinDbg gotchas
So, WinDbg is a weird beast, here are a few things to know:
- lookups can be slow, for example:
!object \can take 1s per line on my setup ! - “normal”, dot, and bang commands are, respectively: built-ins, meta commands controlling the debugger itself, commands from extensions (source).
- numbers are in hex by default (20 => 0x20)
Cheat “sheet”
symbols
.reload /f => force symbol reload
.reload /unl module => force symbol reload for a module that's not loaded
disassembly
u address => disassembly (ex: u ntdll+0x1000).
"u ." => eip
u . l4 => 4 lines from eip
breakpoints, running
bc nb => clear bp nb
bd nb => disable bp nb
bc/bd * => clear/disable all bps
bp addr => set bp
bp /1 addr => bp one-shot (deleted after first trig)
bl => list bp
ba => hardware bp
ba r 8 /p addr1 /t addr2 addr3
  => r==break RW access ;
     8==size to monitor ;
     /p EPROCESS address (process) ;
     /t thread addresse
     addr3 == actual ba adress
bp addr ".if {command1;command2} .else {command}"
p => single step
pct => continue til next call or ret
gu => go til next ret
data
da - dump ascii
db - dump bytes  => displays byte + ascii
dd - dump DWords
dp - dump pointer-sized values
dq - dump QWords
du - dump Unicode (16 bits characters)
dw - dump Words
deref => poi(address)
!da !db !dq addr => display mem at PHYSICAL address
editing:
ed addr value => set value at given address
eq => qword
a addr => assemble (x86 only) at this address (empty line to finish=)
structures:
dt nt!_EPROCESS addr => dump EPROCESS struct at addr
State, processes, etc
lm       => list modules
kb, kv   => callstack
!peb     => peb of current process
!teb     => teb of current thread
!process 0 0 => display all processes
!process my_process.exe => show info for "my_process.exe"
!sd addr => dump security descriptor
drivers:
!object \Driver\
!drvobj Asgio2 => dump \Driver\Asgio2
devices:
!devobj Asgio2 => dump \Device\Asgio2
memory:
!address => dump address space
!pte VA => dump PTEs for VA
Thanks
A lot of thanks to Fist0urs for the help and cheat sheet ;)